
[ad_1]
The benchmark index has witnessed a one-way fall from the all-time high of 20,222.45, marked on 15 September 2023 to a low of 19,333.6 yesterday. That’s a cut of around 890 points in a mere 11 sessions. But now the question is, is the trend over or we might still see some more downside?
In the previous session, the index tumbled to a 1-month low, and from there, it recovered sharply, forming a Doji-like candlestick pattern on the daily chart. This is not a perfect Doji, but the price action almost conforms to a probable bounce from here.
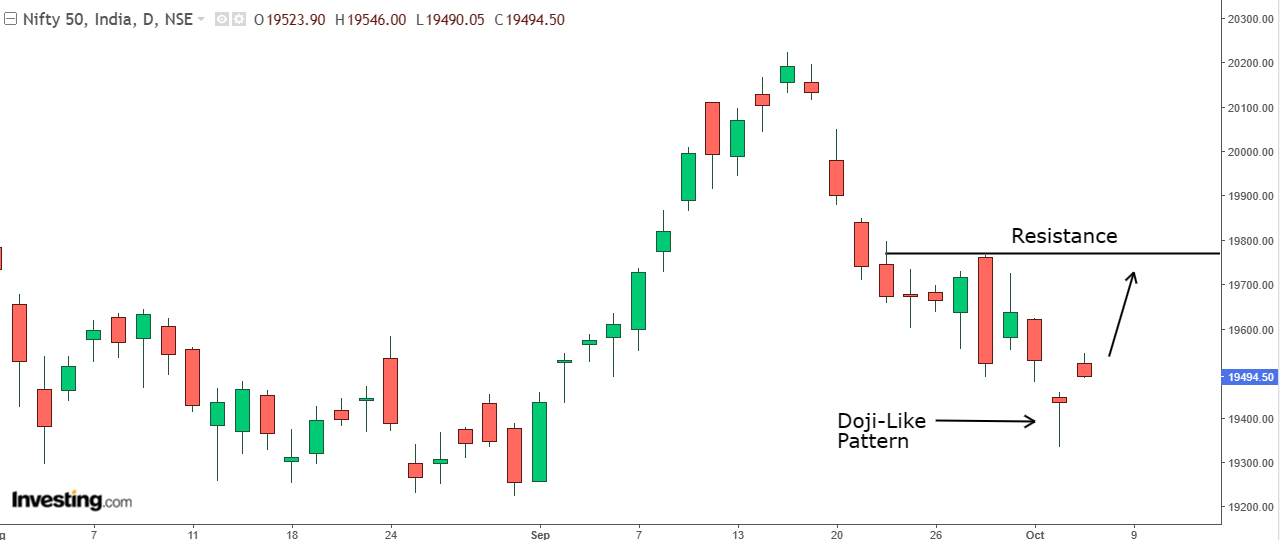
Image Description: Daily chart of Nifty 50 (spot)
Image Source: Investing.com
Doji marks an indecision among market participants and after a sharp fall/rise, it becomes a key indication of a trend reversal or at least a short-term counter-trend move, which is probably the case with Nifty 50. The follow-up buying in today’s session is further strengthening the bounce.
Another thing that could propel a good rally from here is that the nearest resistance level is still a bit far from the CMP of 19,500, at 19,766. So, there’s still a potential for a 266-odd point rally. As long as the low of yesterday is not breached, very short-term traders can explore long opportunities.
However, the trend is still negative and will likely remain so till Nifty 50 is trading below its previous swing high of 19,766 (the resistance). However, a bounce from the lower levels could definitely come, especially after a sharp decline from the highs and the Doji-like candlestick pattern at the bottom. Even in this case, the resistance should carefully be watched out for and very ambitious long targets should be avoided.
Disclosure: I have multiple positions in Nifty 50 options.
X (formerly, Twitter) – aayushxkhanna

[ad_2]
Source link


